Tidyverse: Data wrangling & visualization
2024-04-18
Overview
0.1 Introduction
This tutorial is an introduction to data wrangling and visualization using functions from the tidyverse. It uses data from the Palmer Station’s Long Term Ecological Research program based in Antarctica, including the palmerpenguins and weather monitoring data. These lessons walk through key steps in the data wrangling phase, including subsetting data, summarizing data at aggregate levels, creating new variables using conditional statements, working with dates, joining together multiple data frames, and reshaping data. This lesson also provides an introduction to combining data wrangling with visualization.
Prerequisites
- Installation of R and RStudio
- General knowledge of R’s base functionality (math, naming objects) (note: you can familiarize yourself with R’s base functionality and RStudio’s layout here)
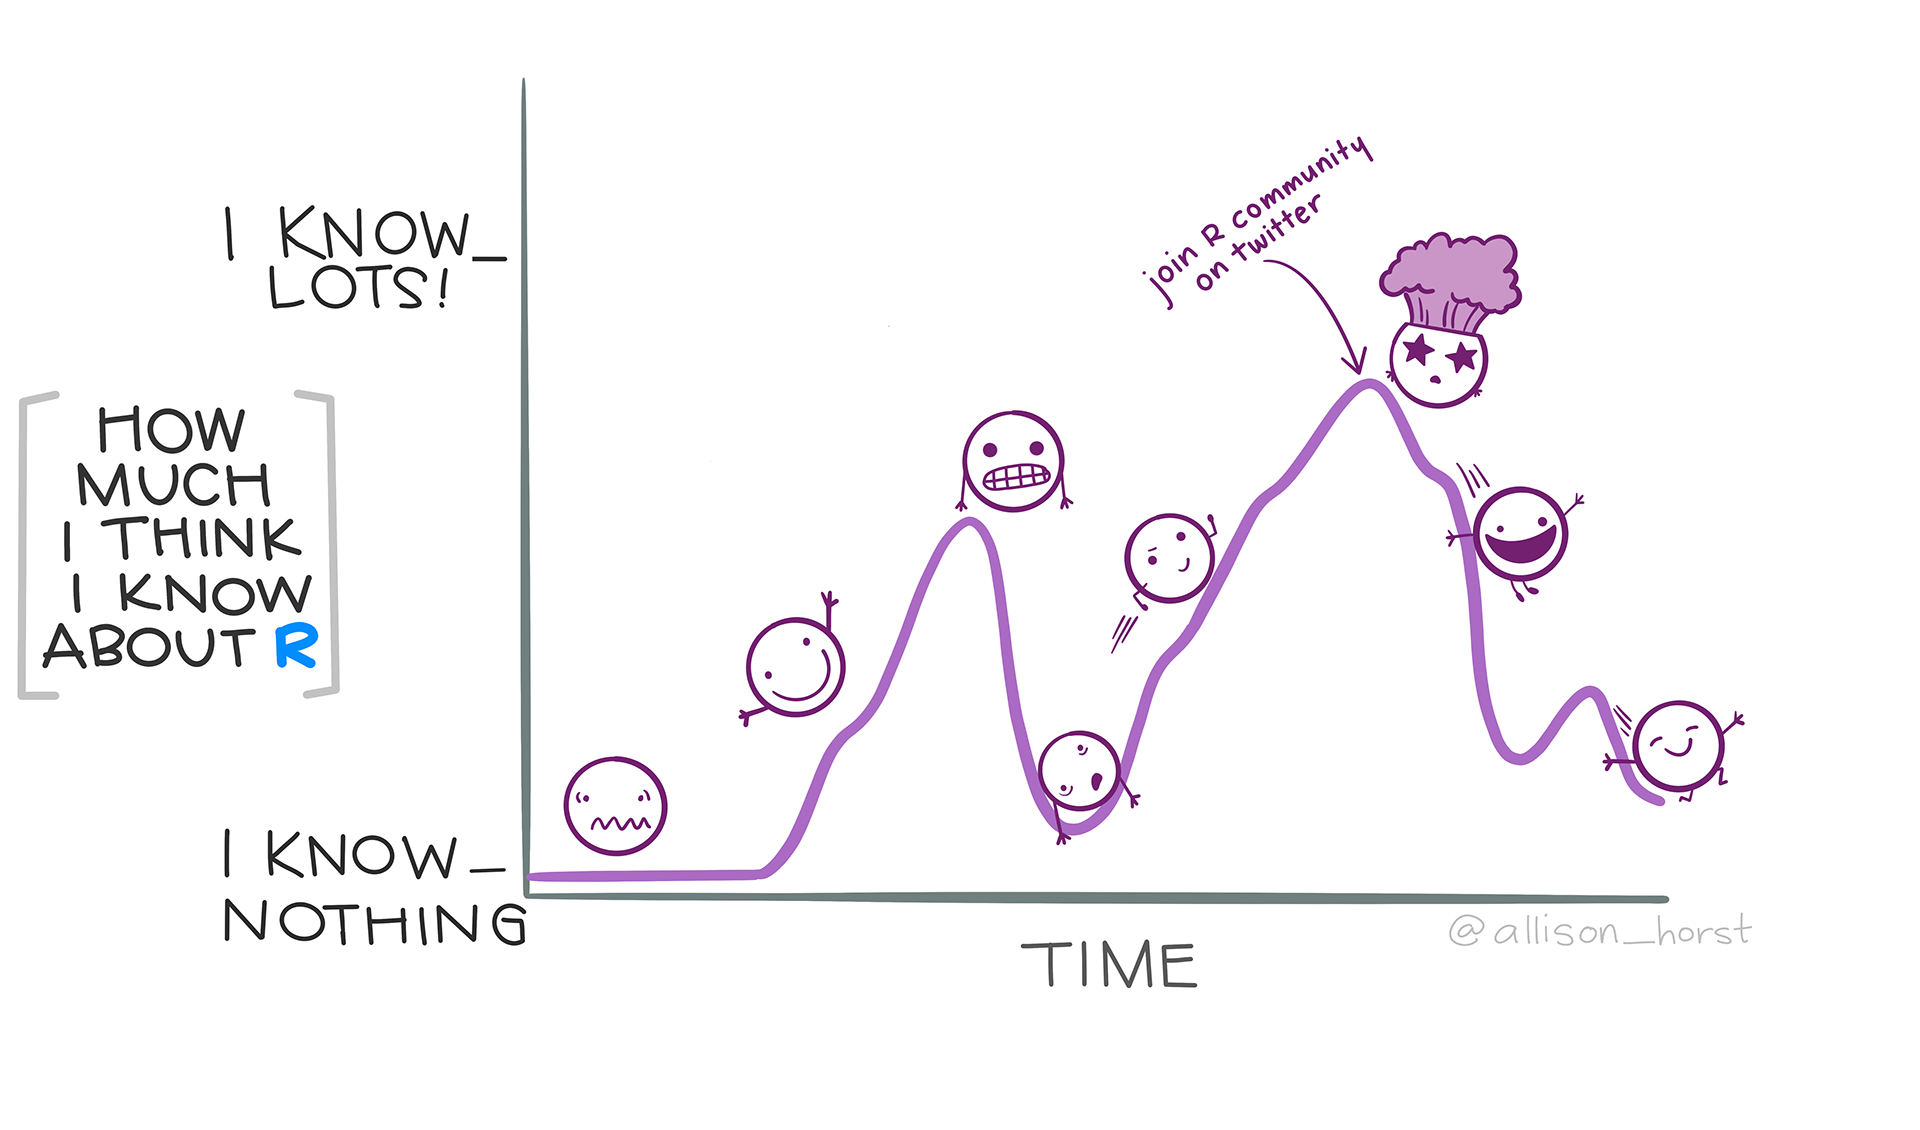
Figure 0.1: Artwork by @allison_horst
0.2 Acknowledgements
This site was developed based on material from UC Davis’s R-DAVIS course, which draws heavily on Carpentries R lessons. Additionally, artwork is from Allison Horst (@allison_horst) and website styling was also based on the designs from the Palmer Penguins package webpage