2 Data
2.1 Palmer Station penguins
The Palmer Station penguins data is a tidy data set related to three species of Antarctic penguins from Horst, Hill, and Gorman (2020)1.
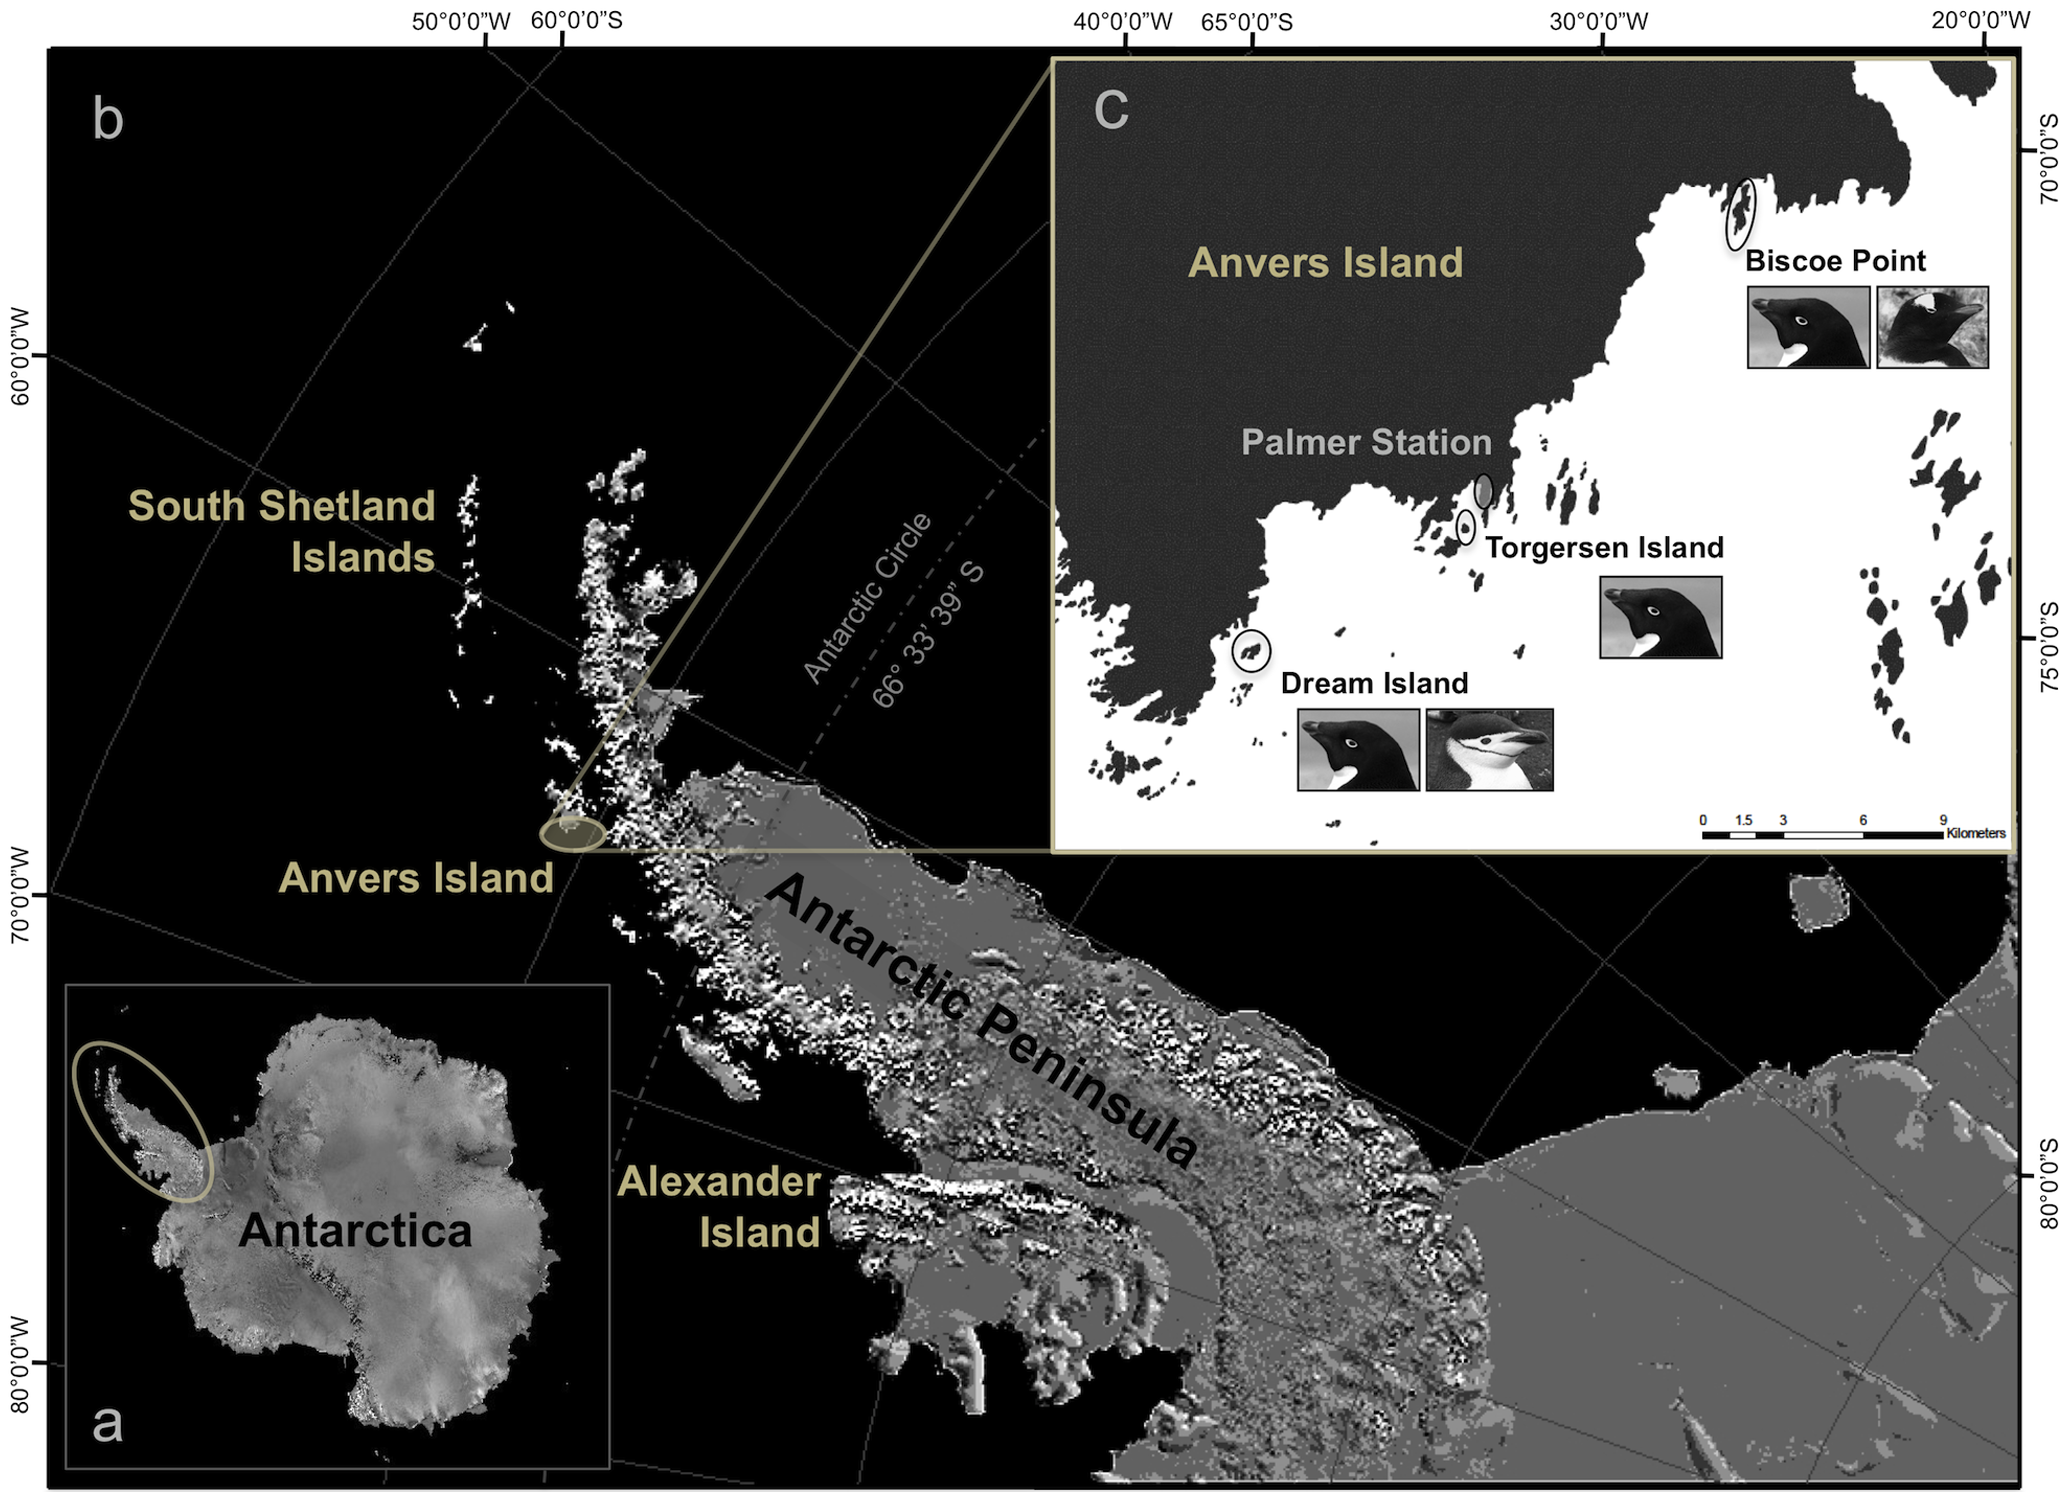
The data contains size measurements for male and female adult foraging Adélie, Chinstrap, and Gentoo penguins observed on islands in the Palmer Archipelago near Palmer Station, Antarctica between 2007-2009. Data were collected and made available by Dr. Kristen Gorman and the Palmer Station Long Term Ecological Research (LTER) Program. You can read more about the package here.
Let’s start by installing the package in one of two ways:
# Install from CRAN
install.packages('palmerpenguins')
# Or install directory from the github repository
remotes::install_github("allisonhorst/palmerpenguins")
Now we can load in the package library, which stores the penguins dataset.
## # A tibble: 6 × 8
##   species island    bill_length_mm bill_depth_mm flipper_length_mm body_mass_g
##   <fct>   <fct>              <dbl>         <dbl>             <int>       <int>
## 1 Adelie  Torgersen           39.1          18.7               181        3750
## 2 Adelie  Torgersen           39.5          17.4               186        3800
## 3 Adelie  Torgersen           40.3          18                 195        3250
## 4 Adelie  Torgersen           NA            NA                  NA          NA
## 5 Adelie  Torgersen           36.7          19.3               193        3450
## 6 Adelie  Torgersen           39.3          20.6               190        3650
## # ℹ 2 more variables: sex <fct>, year <int>
Learn more about each variable in the documentation
Let’s take a look at its structure:
## tibble [344 × 8] (S3: tbl_df/tbl/data.frame)
##  $ species          : Factor w/ 3 levels "Adelie","Chinstrap",..: 1 1 1 1 1 1 1 1 1 1 ...
##  $ island           : Factor w/ 3 levels "Biscoe","Dream",..: 3 3 3 3 3 3 3 3 3 3 ...
##  $ bill_length_mm   : num [1:344] 39.1 39.5 40.3 NA 36.7 39.3 38.9 39.2 34.1 42 ...
##  $ bill_depth_mm    : num [1:344] 18.7 17.4 18 NA 19.3 20.6 17.8 19.6 18.1 20.2 ...
##  $ flipper_length_mm: int [1:344] 181 186 195 NA 193 190 181 195 193 190 ...
##  $ body_mass_g      : int [1:344] 3750 3800 3250 NA 3450 3650 3625 4675 3475 4250 ...
##  $ sex              : Factor w/ 2 levels "female","male": 2 1 1 NA 1 2 1 2 NA NA ...
##  $ year             : int [1:344] 2007 2007 2007 2007 2007 2007 2007 2007 2007 2007 ...
2.2 Palmer Station weather
To practice data wrangling skills, this tutorial will also use another data set from the Antarctic LTER Program – the ‘Daily averaged weather timeseries at Palmer Station, Antarctica’2, which includes various weather metrics measured between 1989-2019. We’ll read in these data directly from online and name the data frame weather.
weather <- read.csv("https://pasta.lternet.edu/package/data/eml/knb-lter-pal/28/8/375b34051b162d84516ec2d02f864675") These data have been made available through the Environmental Data Initiative and more information can be found here
Let’s take a look at the data’s structure:
## 'data.frame':    10674 obs. of  24 variables:
##  $ Date                           : chr  "1989-04-01" "1989-04-02" "1989-04-03" "1989-04-04" ...
##  $ Temperature.High..C.           : num  2.8 1.1 -0.6 1.1 -0.6 2.5 -1.4 -0.8 -1 -1.5 ...
##  $ Temperature.Low..C.            : num  -1 -2.7 -3.5 -4.4 -2.9 -3.1 -3.2 -4.5 -4 -3.8 ...
##  $ Temperature.Average..C.        : num  0.9 -0.8 -2.05 -1.65 -1.75 -0.3 -2.3 -2.65 -2.5 -2.65 ...
##  $ Sea.Surface.Temperature..C.    : num  NA NA NA NA NA NA NA NA NA NA ...
##  $ Sea.Ice..WMO.Code.             : chr  "" "" "" "" ...
##  $ Pressure.High..mbar.           : num  1004 998 998 1002 1002 ...
##  $ Pressure.Low..mbar.            : num  998 995 995 998 997 ...
##  $ Pressure.Average..mbar.        : num  1001 996 997 1000 1000 ...
##  $ Windspeed.Peak                 : int  18 24 13 14 14 15 16 39 27 16 ...
##  $ Windspeed.5.Sec.Peak           : num  NA NA NA NA NA NA NA NA NA NA ...
##  $ Windspeed.2.Min.Peak           : int  NA NA NA NA NA NA NA NA NA NA ...
##  $ Windspeed.Average              : num  4 9 8 6 4 4 8 14 11 6 ...
##  $ Wind.Peak.Direction..True...º. : int  110 30 60 210 230 180 40 120 50 60 ...
##  $ Wind.Peak.Direction..º.        : int  NA NA NA NA NA NA NA NA NA NA ...
##  $ Wind.5.Sec.Peak.Direction...º. : int  NA NA NA NA NA NA NA NA NA NA ...
##  $ Wind.2.Min.Peak.Direction...º. : int  NA NA NA NA NA NA NA NA NA NA ...
##  $ Wind.Direction.Prevailing      : chr  "SW" "NE" "NE" "NW" ...
##  $ Rainfall..mm.                  : num  0 0 0 0 0 0 1 0 0 -998 ...
##  $ Precipitation.Snow..cm.        : num  0 0 0 0 0 0 -998 0 0 -998 ...
##  $ Depth.at.Snowstake..cm.        : num  NA NA NA NA NA NA NA NA NA NA ...
##  $ Cloud.Cover                    : int  4 2 5 5 10 2 9 5 0 10 ...
##  $ Data.flag...Temperature.Average: chr  "C" "C" "C" "C" ...
##  $ Data.flag...Pressure.Average   : chr  "C" "C" "C" "C" ...
Together this tutorial uses data collected from penguins across three islands in the Palmer archipelago and weather sensing technology at the US Palmer Station.


Figure 2.1: A: Artwork by @allison_horst | B: Palmer archipelago, image from Gorman et al. 2014 Figure 1
Horst AM, Hill AP, Gorman KB (2020). palmerpenguins: Palmer Archipelago (Antarctica) penguin data. R package version 0.1.0. https://allisonhorst.github.io/palmerpenguins/. doi: 10.5281/zenodo.3960218.↩︎
Palmer Station Antarctica LTER and P. Information Manager. 2019. Daily averaged weather timeseries (air temperature, pressure, wind speed, wind direction, precipitation, sky cover) at Palmer Station, Antarctica combining manual observations (1989 - Dec 12, 2003) and PALMOS automatic weather station measurements (Dec 13, 2003 - March 2019). ver 8. Environmental Data Initiative. https://doi.org/10.6073/pasta/cddd3985350334b876cd7d6d1a5bc7bf (Accessed 2023-03-27).↩︎